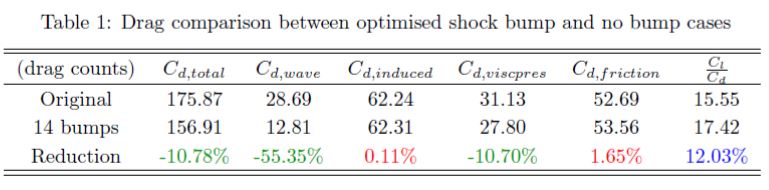
The following table shows a comparison of the drag decomposition using a far field drag analysis tool. When the bumps are deployed, the drag is reduced by just under 19 drag counts. The table also shows that the most significant reduction is the wave drag while the skin friction remains nearly the same with a very slight increase, which is common when using shock bumps from previous research. It is interesting to note that the lift induced drag remains nearly the same. The viscous drag due to pressure has also shown a significant reduction, indication a form drag reduction as a result of the shock control bumps, contrary to conventional thinking.
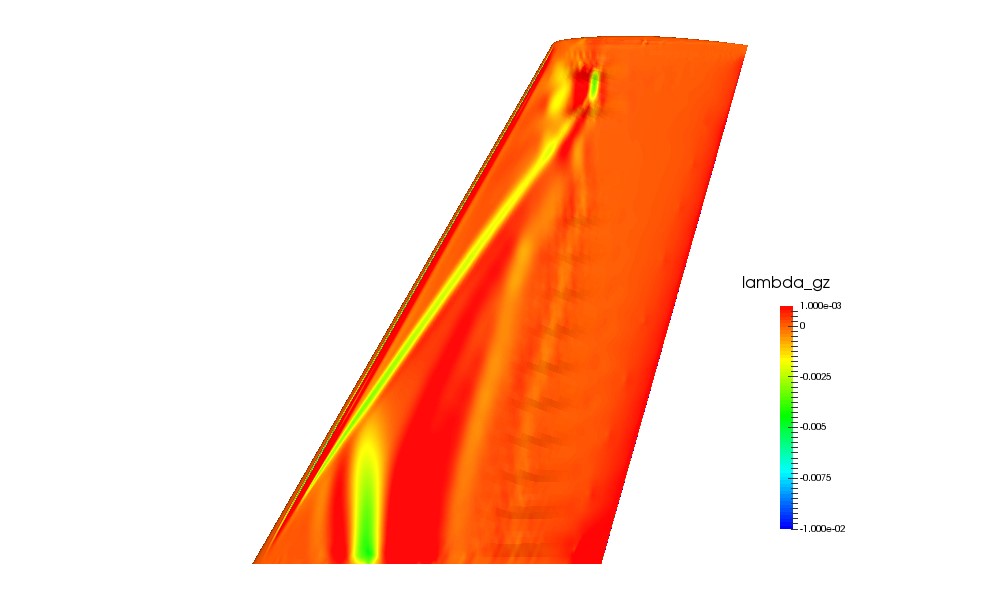
The following figure shows the surface sensitivity for the upper surface of the original M6 wing after the bump optimisation is applied. The sensitivity map after the optimisation can be used to evaluate the effectiveness of the drag optimisation. For most of the span the sensitivity of drag to changes in the surface has been reduced significantly in the rear shock area. The only area that still shows a relatively strong sensitivity in the optimisation region is between the two bumps at the tip of the wing. A possible explanation for this is that the shock is so strong in this location that the bumps cannot grow high enough to treat it without incurring a drag penalty elsewhere. This could be addressed by improving the bump parametrisation such that a shape can be found that will act directly on this region. It is interesting to note that in this comparison the non-shock sensitivity region is reduced after the bump optimisation despite no optimisation taking place in the local vicinity. This is not surprining since the flow over the surface in the rear shock and non-shock regions are linked for subsonic flows.
Surface sensitivity for final iteration of optimisation