Moderate shock intensity configuration (a=2.5°)
Figure 4 presents a comparison of Schlieren views of the viscous interaction. The reflection (barely visible) on the shock wedge of the oblique shock emanating from the flat plate leading edge (i.e., a Mach wave) is far downstream of the flat plate and, then, does not disturb the viscous interaction under study (the flat plate begins at x = 0). The incoming laminar boundary layer is separated due to the impact of the shock-wave: a long laminar separation bubble is clearly visible in both pictures. An expansion fan is generated by the propagation of the shock in the boundary layer and induces, as the incident shock, a deviation of the flow towards the wall. The initial direction is finally recovered through a spread out compression. The laminar / turbulent transition occurs in the reattachment point vicinity and vortex structures are visible in the mixing layer downstream of the interaction region. One can observe that the shock impinges 4 mm more upstream in the experiment than in the LES. This discrepancy is believed to be of modest consequences since the Reynolds number dependence on the separation length is very weak.
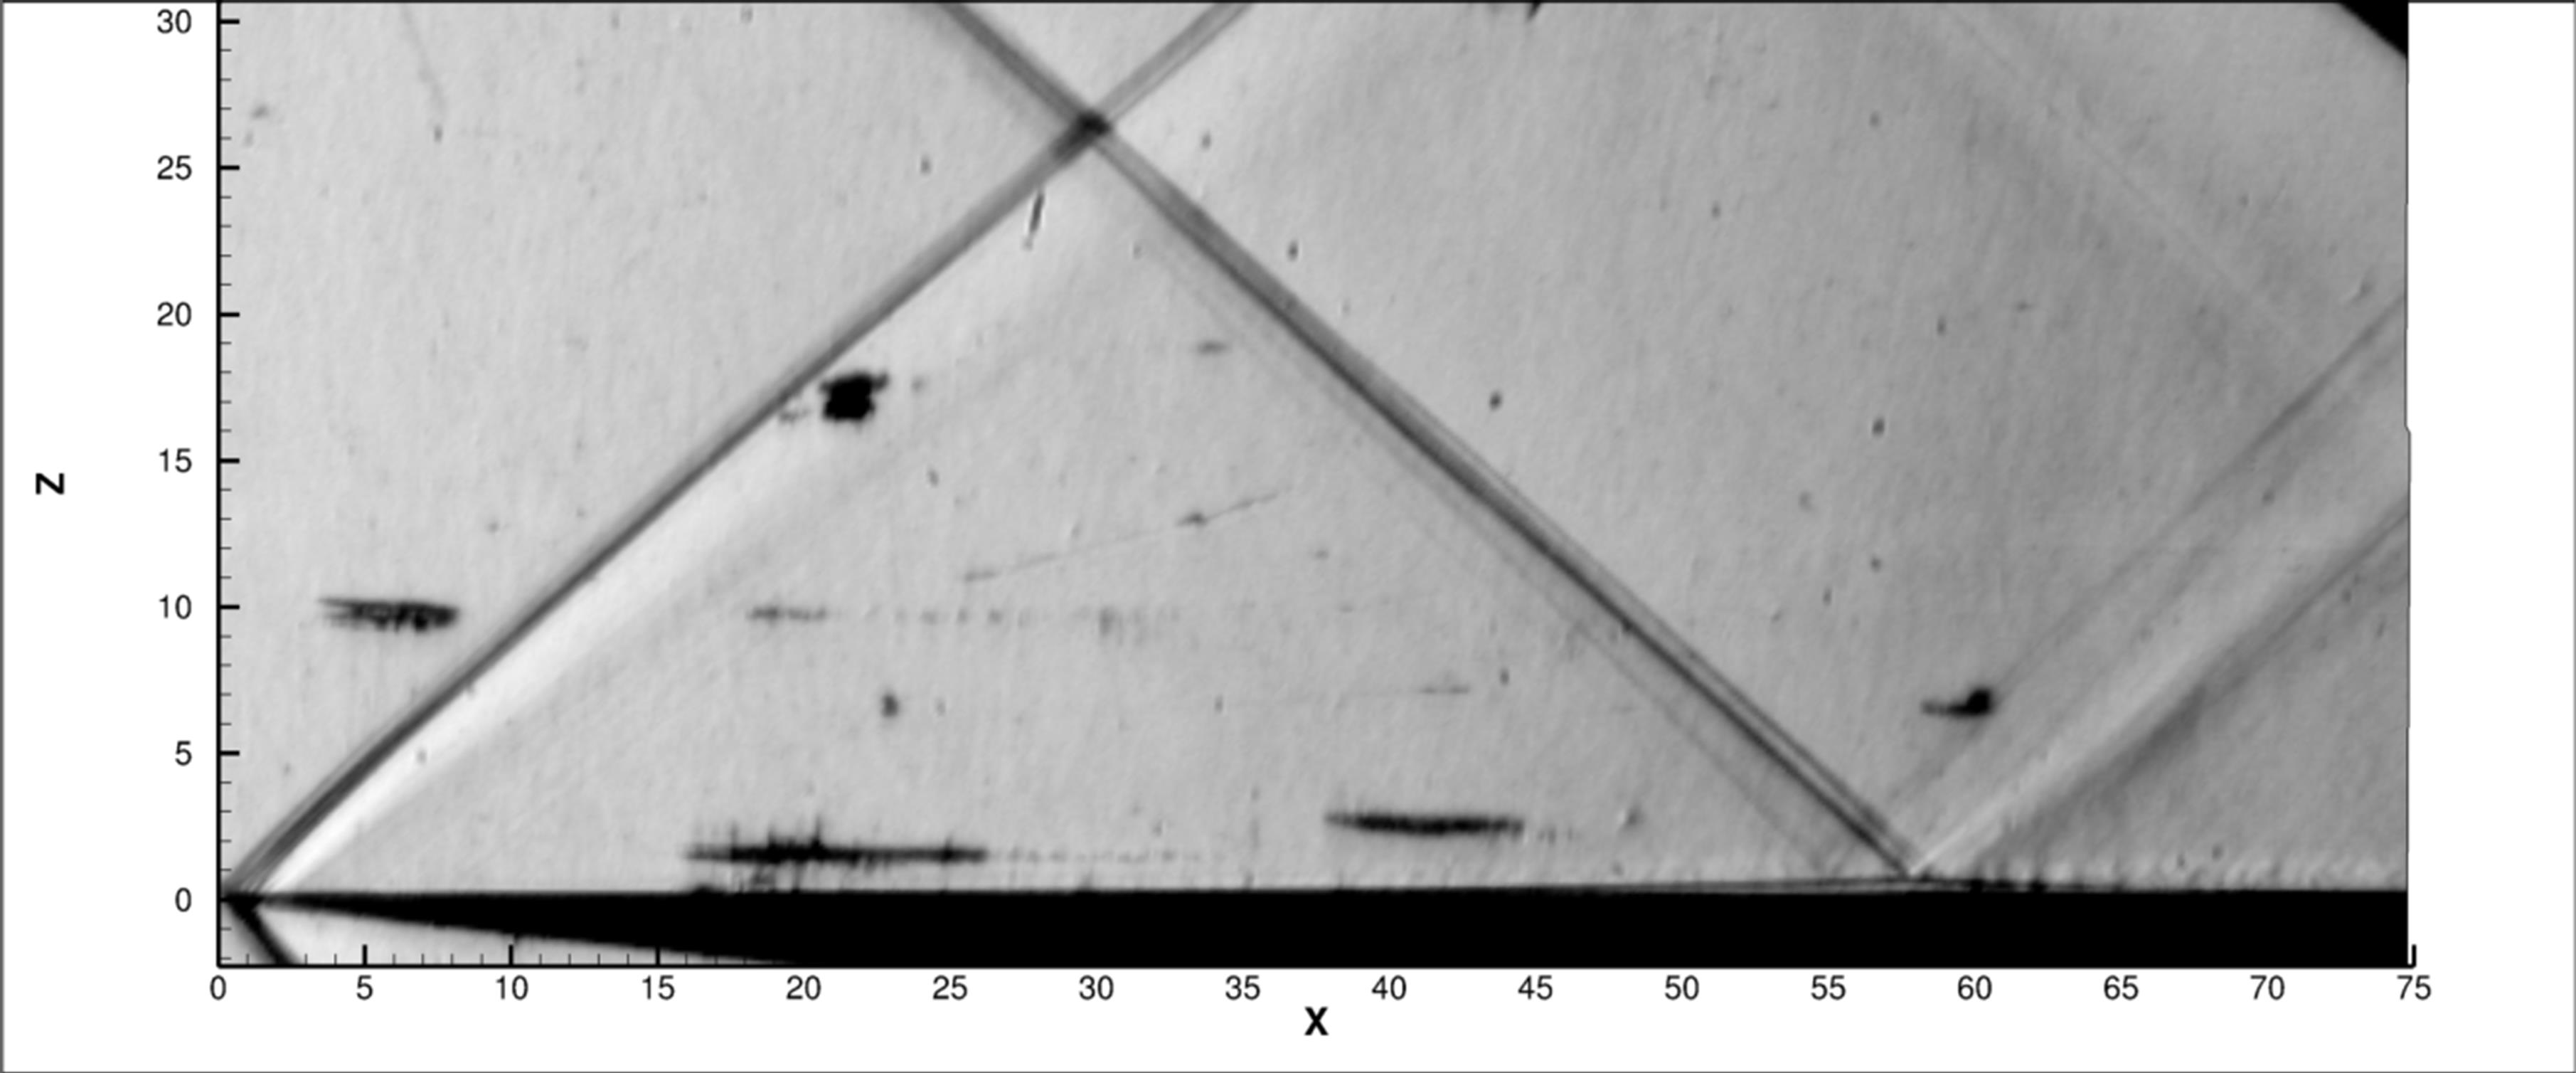
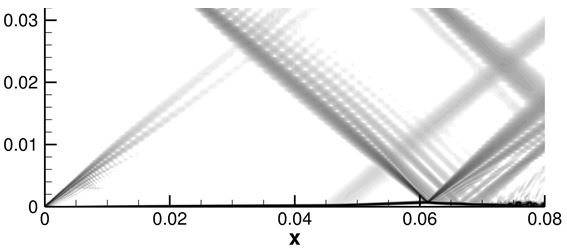
Figure 5 presents a comparison of temperature distributions along the flate plate, one for LES and two for experiments (provided by IR thermography and TSP measurements). The experimental curves are similar (even if TSP treatment generates a noisy behaviour) and lead to an increase of temperature around 2 degrees during the transition process. Temperature drop provided by LES is around 4 degrees, which is closer to the Crocco’s law result based on adiabatic assumption of the flow, which gives: ΔT = 5° at Mach number of 1.6.
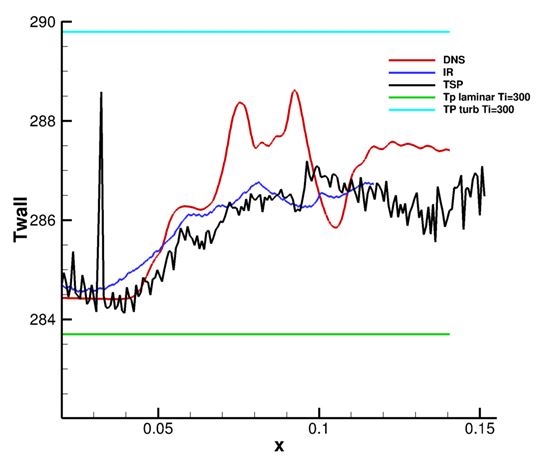
Figure 6 plots the (numerical) longitudinal evolution of the friction coefficient (Cf), the wall pressure and the maximum of the turbulent kinetic energy in the vertical direction. Each quantity is affected by the expansion originating from the shock generator trailing edge (at around x = 0.1m). It appears that the the turbulent kinetic energy undergoes a sudden growth at about 80% of the separation bubble length. A pressure plateau is clearly visible in the separation bubble delimited by negative values of Cf. Then, the beginning of transition is located at 80% of bubble extension and transition is achieved after reattachment. From x = 0.07m, the fully developed nature of the turbulent boundary layer is clearly illustrated by
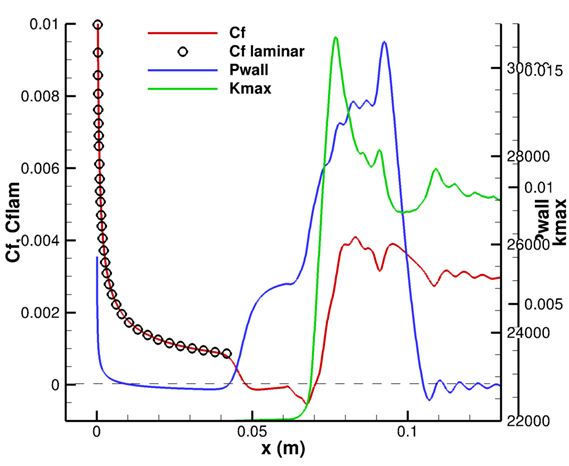
Figure 7 which presents one iso-value of the Q criterion: the flow becomes tridimensional at the reattachment point.
Strong shock intensity configuration (α=5°)
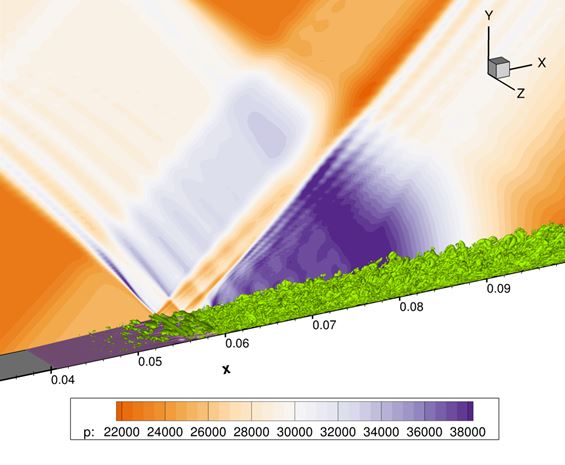
Figure 8 presents a comparison of Schlieren views of the viscous interaction. The longitudinal extent of the separation bubble is very similar in the experiment and in the computation. Nonetheless, some density fluctuations are distinguishable in the experiment which suggests that the transition process is initiated earlier in the experiment than in the computation. This is consistent that the level of inflow perturbations is larger in the experiment than in the LES.
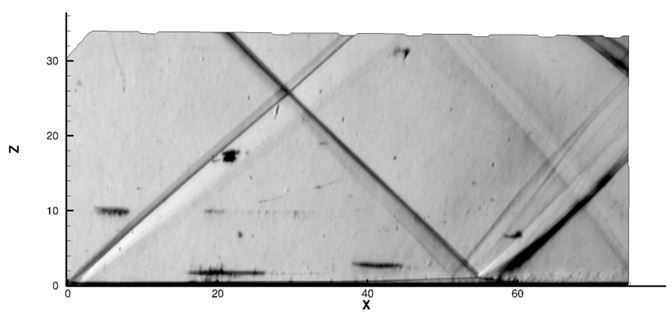
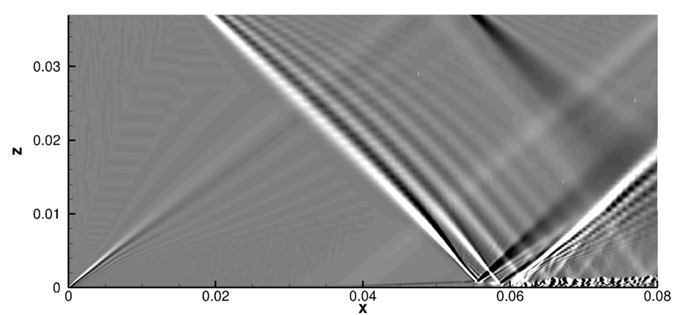
Figure 9 presents a comparison of temperature distributions along the flat plate (its leading edge is at x = 0) between LES and IR thermography measurements. In both cases, temperature is increasing as soon as boundary layer separation occurs. As already observed in the Schlieren views, the transition process is started earlier in the experiment, before the shock impingement, than in the computation for which the plateau of the curve corresponds to a laminar bubble and the peak after around 290 K to a turbulent state just behind the shock impingement. As for the moderate shock intensity configuration, the experiment underestimates the temperature increase (around 2 degrees) during the transition, which is partly due to conduction losses into the plate. Temperature drop provided by LES is around 6 degrees, which is consistent with the one based on adiabatic flow assumption.
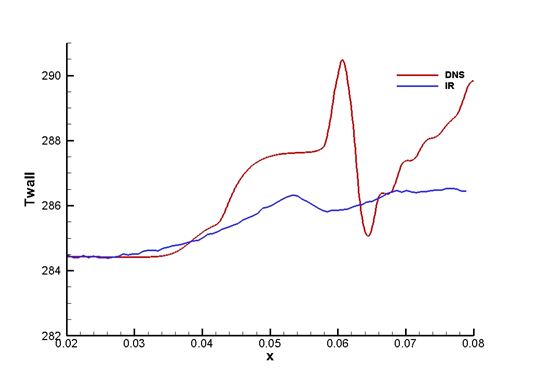
Figure 10 plots the (numerical) longitudinal evolution of the friction coefficient (Cf), the wall pressure and the maximum of the turbulent kinetic energy in the vertical direction. Comparing to the results of the 2.5 degrees case (Figure 6), one can observe that the length of the pressure plateau and of the region of negative friction is much longer in the strong interaction case. In both cases, the maximum of the turbulent kinetic energy raises explosively in the vicinity of the reattachment point.
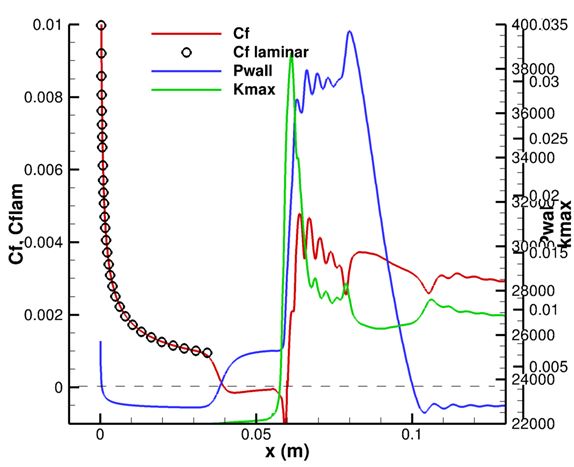
Figure 11 presents one iso-value of the Q criterion. The flow becomes fully turbulent at the reattachment point, but the tri-dimensionality appears earlier than in the moderate shock intensity configuration (Figure 7). Nonetheless, as noticed in Figure 10, the intensity of these first tri-dimensional fluctuations remains low and one has to wait pass the location of the maximum bubble height to see a sudden growth of the fluctuations.
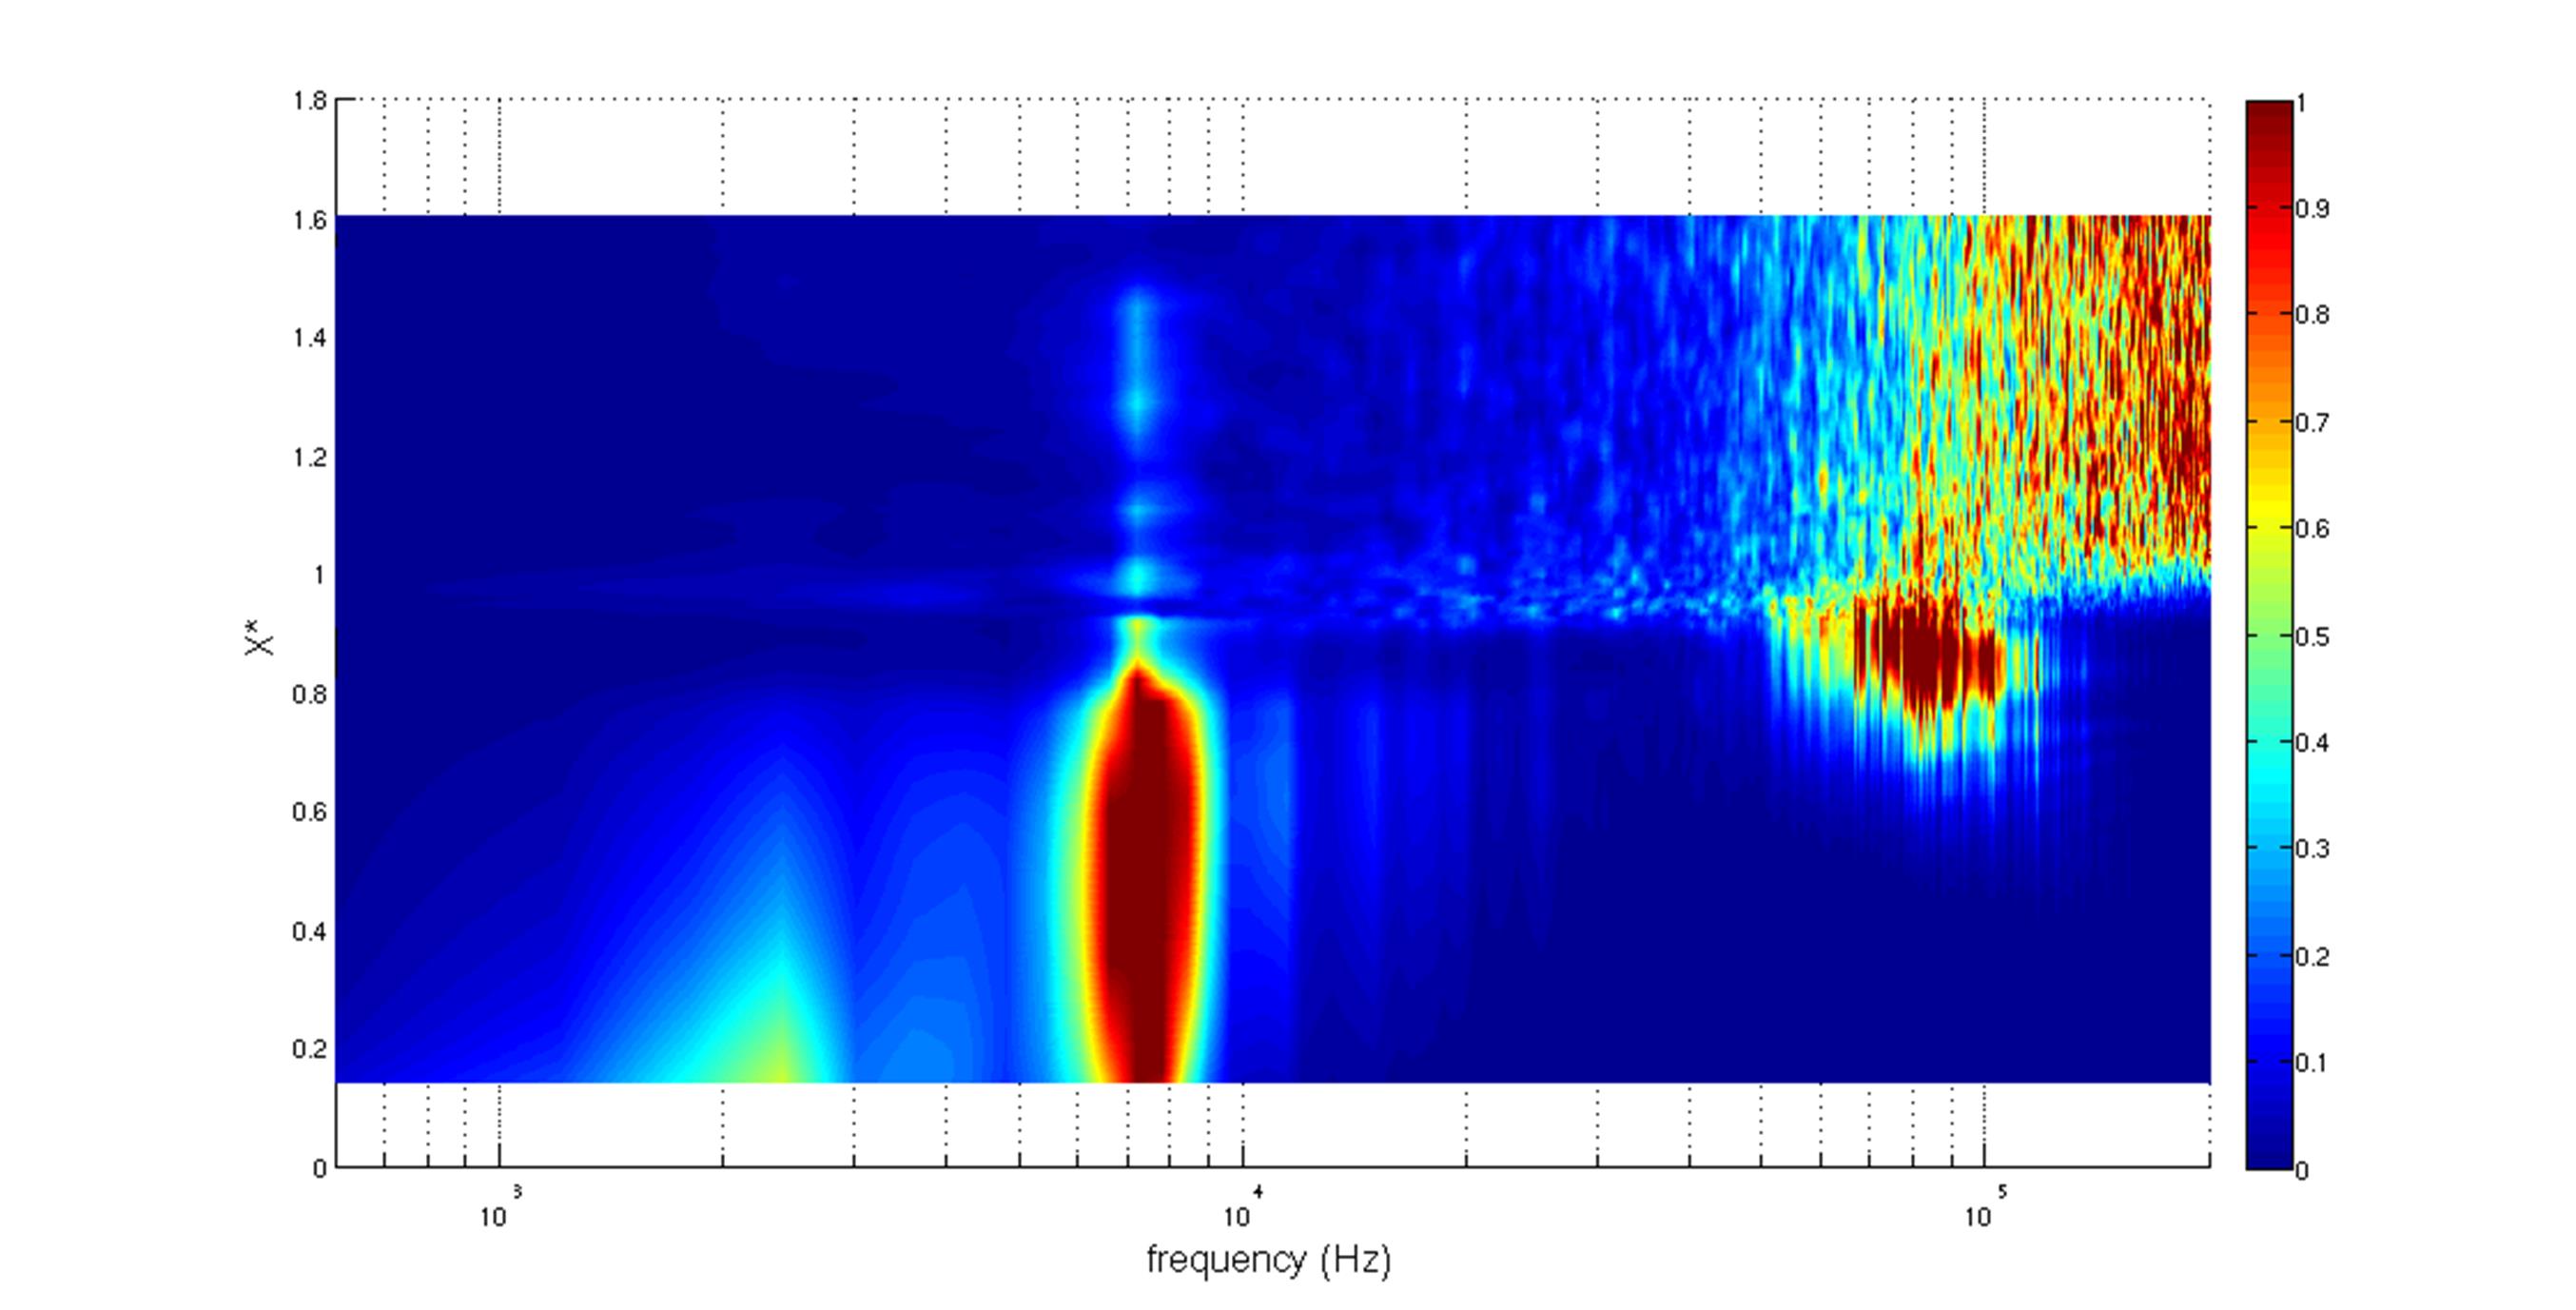
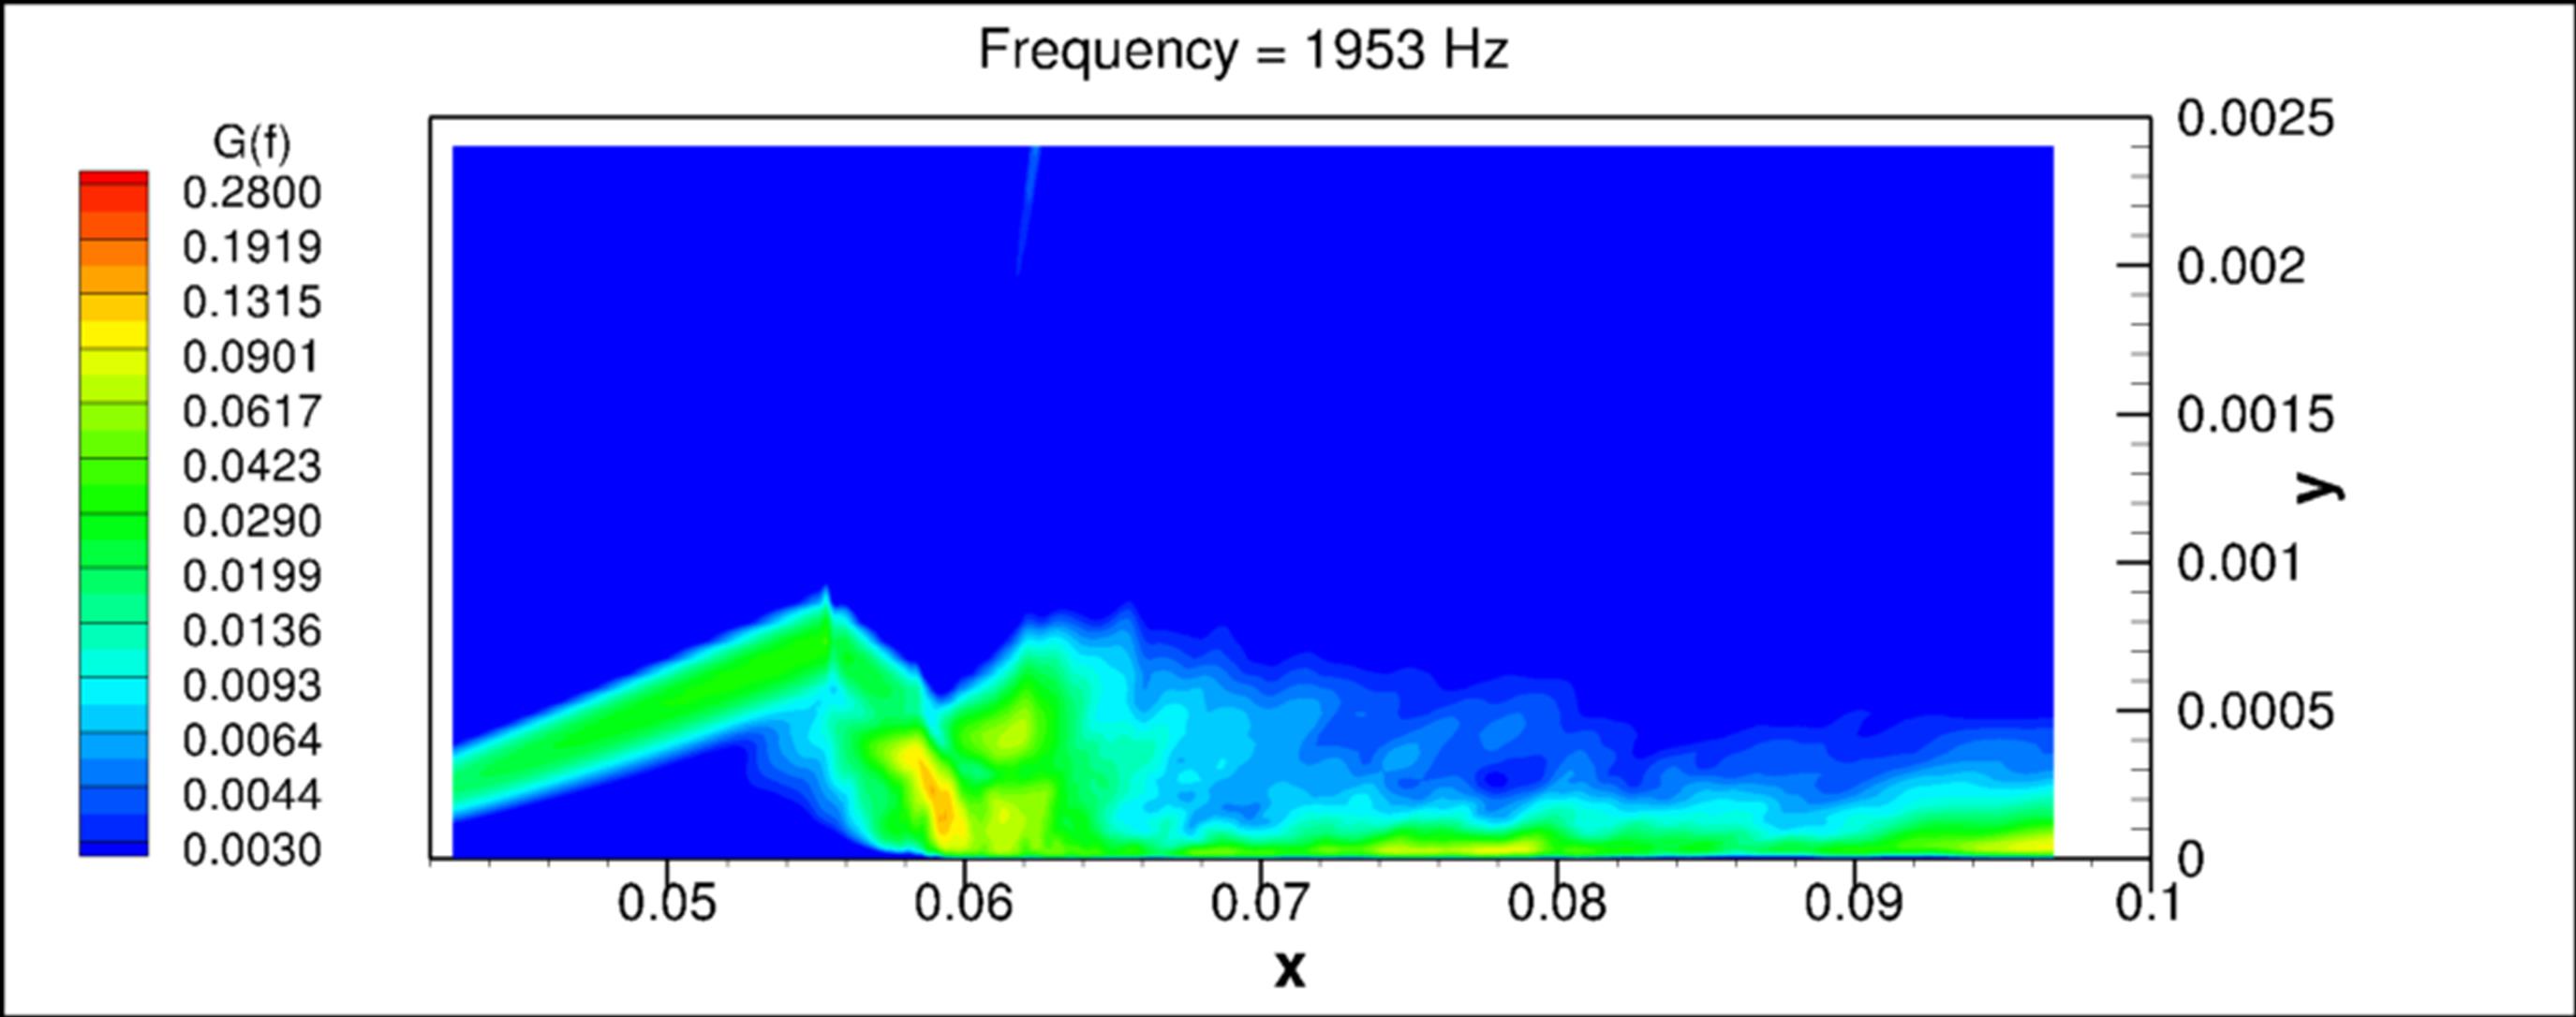
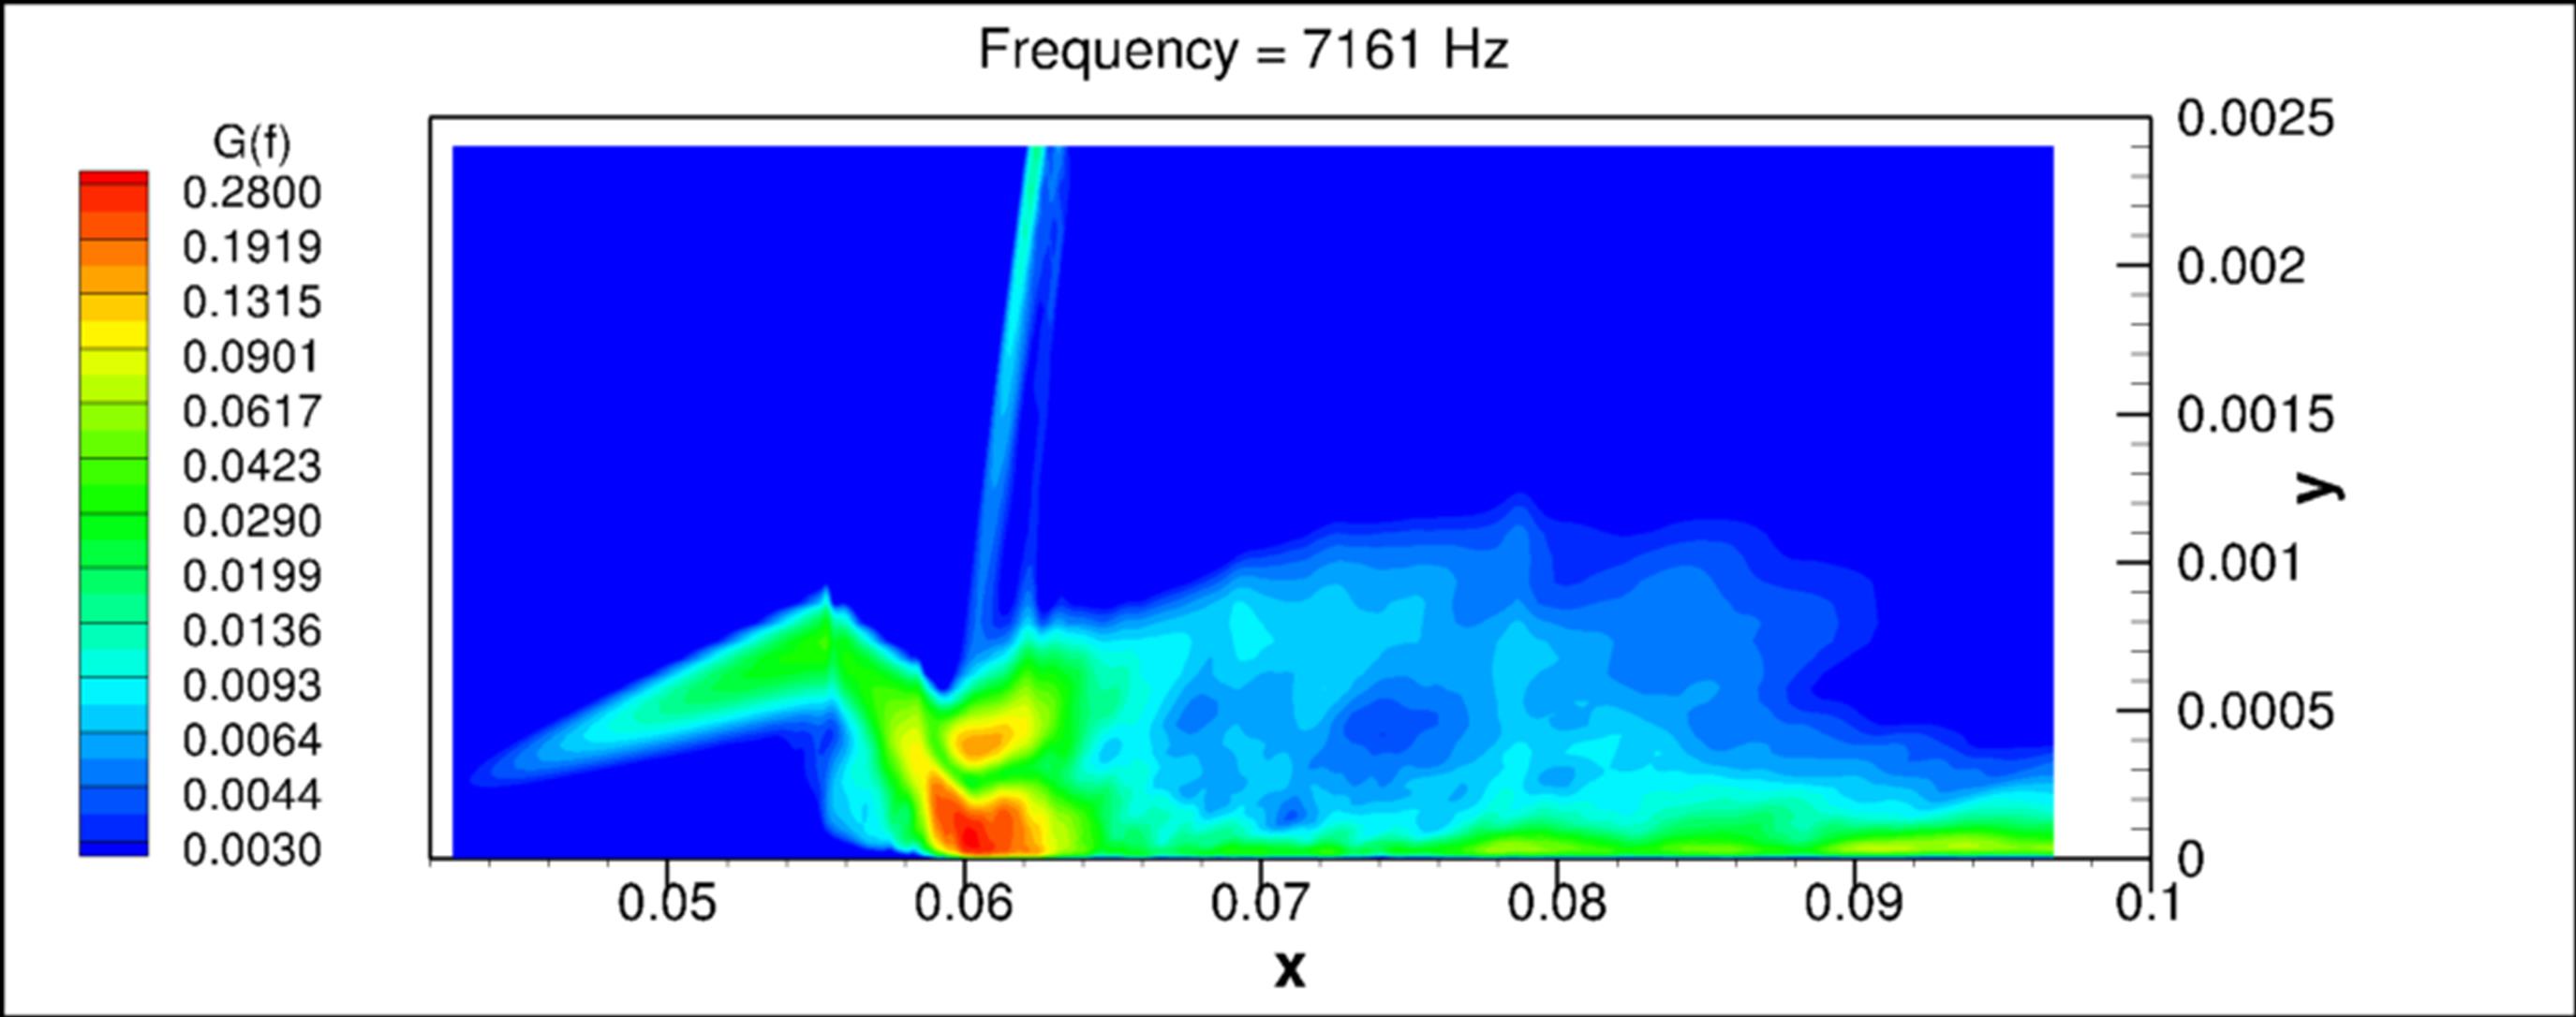
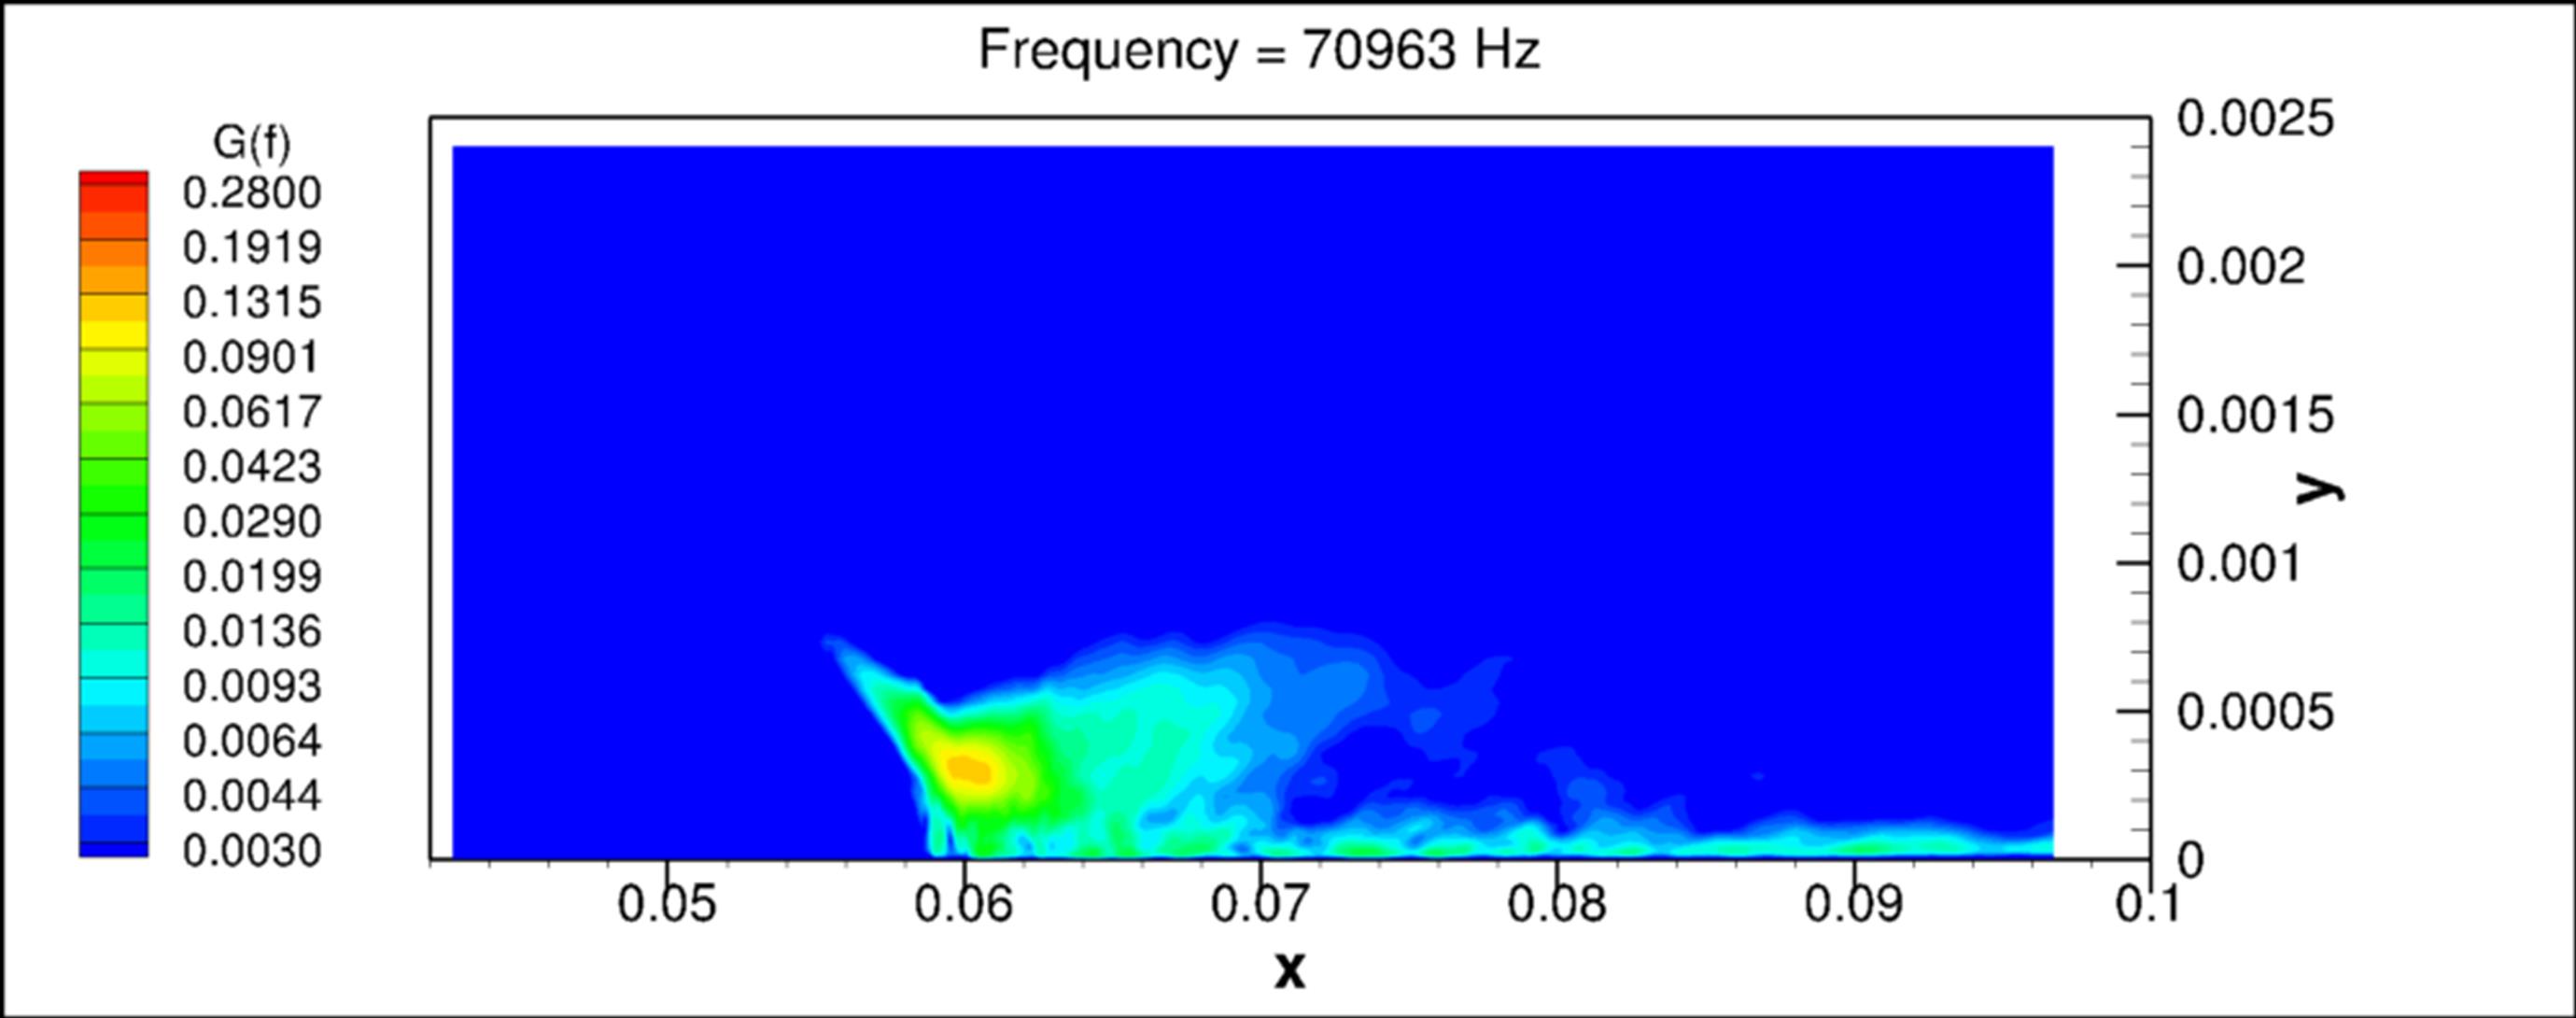
The flow unsteadiness is studied by plotting the longitudinal evolution of the wall pressure fluctuations spectral distribution in Figure 12. The distance X* is defined as: X*=(x-Xsep)/Lsep where Lsep is the separation length and Xsep the mean separation point. Consistently with the work of Larchevèque, it is observed that two low frequency peaks (at around 2.3 and 7 kHz) are present in the separation bubble. These frequencies correspond respectively to Strouhal numbers equal to 0.088 and 0.31. The spatial distribution of these two modes in the central longitudinal plane is plotted in Figure 13. It is observed that the velocity fluctuations are concentred in the shear layer in the upper part of the bubble and the reattachment point, the maximum intensity of the fluctuation being located at this specific point. In the reattachment region, fluctuations are concentrated between 50 and 100 kHz whereas even higher frequencies are registered in the attached turbulent boundary layer downstream from the interaction. The spatial distribution of the velocity fluctuation at a frequency of 70 kHz is presented in Figure 14. It is observed that there is no fluctuation in the upper part of the bubble, the whole energy being concentrated near the reattachment point consistently with the picture of the Q criterion which evidences the appearance of the small turbulent scales at this location. An important conclusion of this work is that a low frequency content of the fluctuations is observed in transitional interactions in the same way as in turbulent interactions as soon as the flow deflection is strong enough.
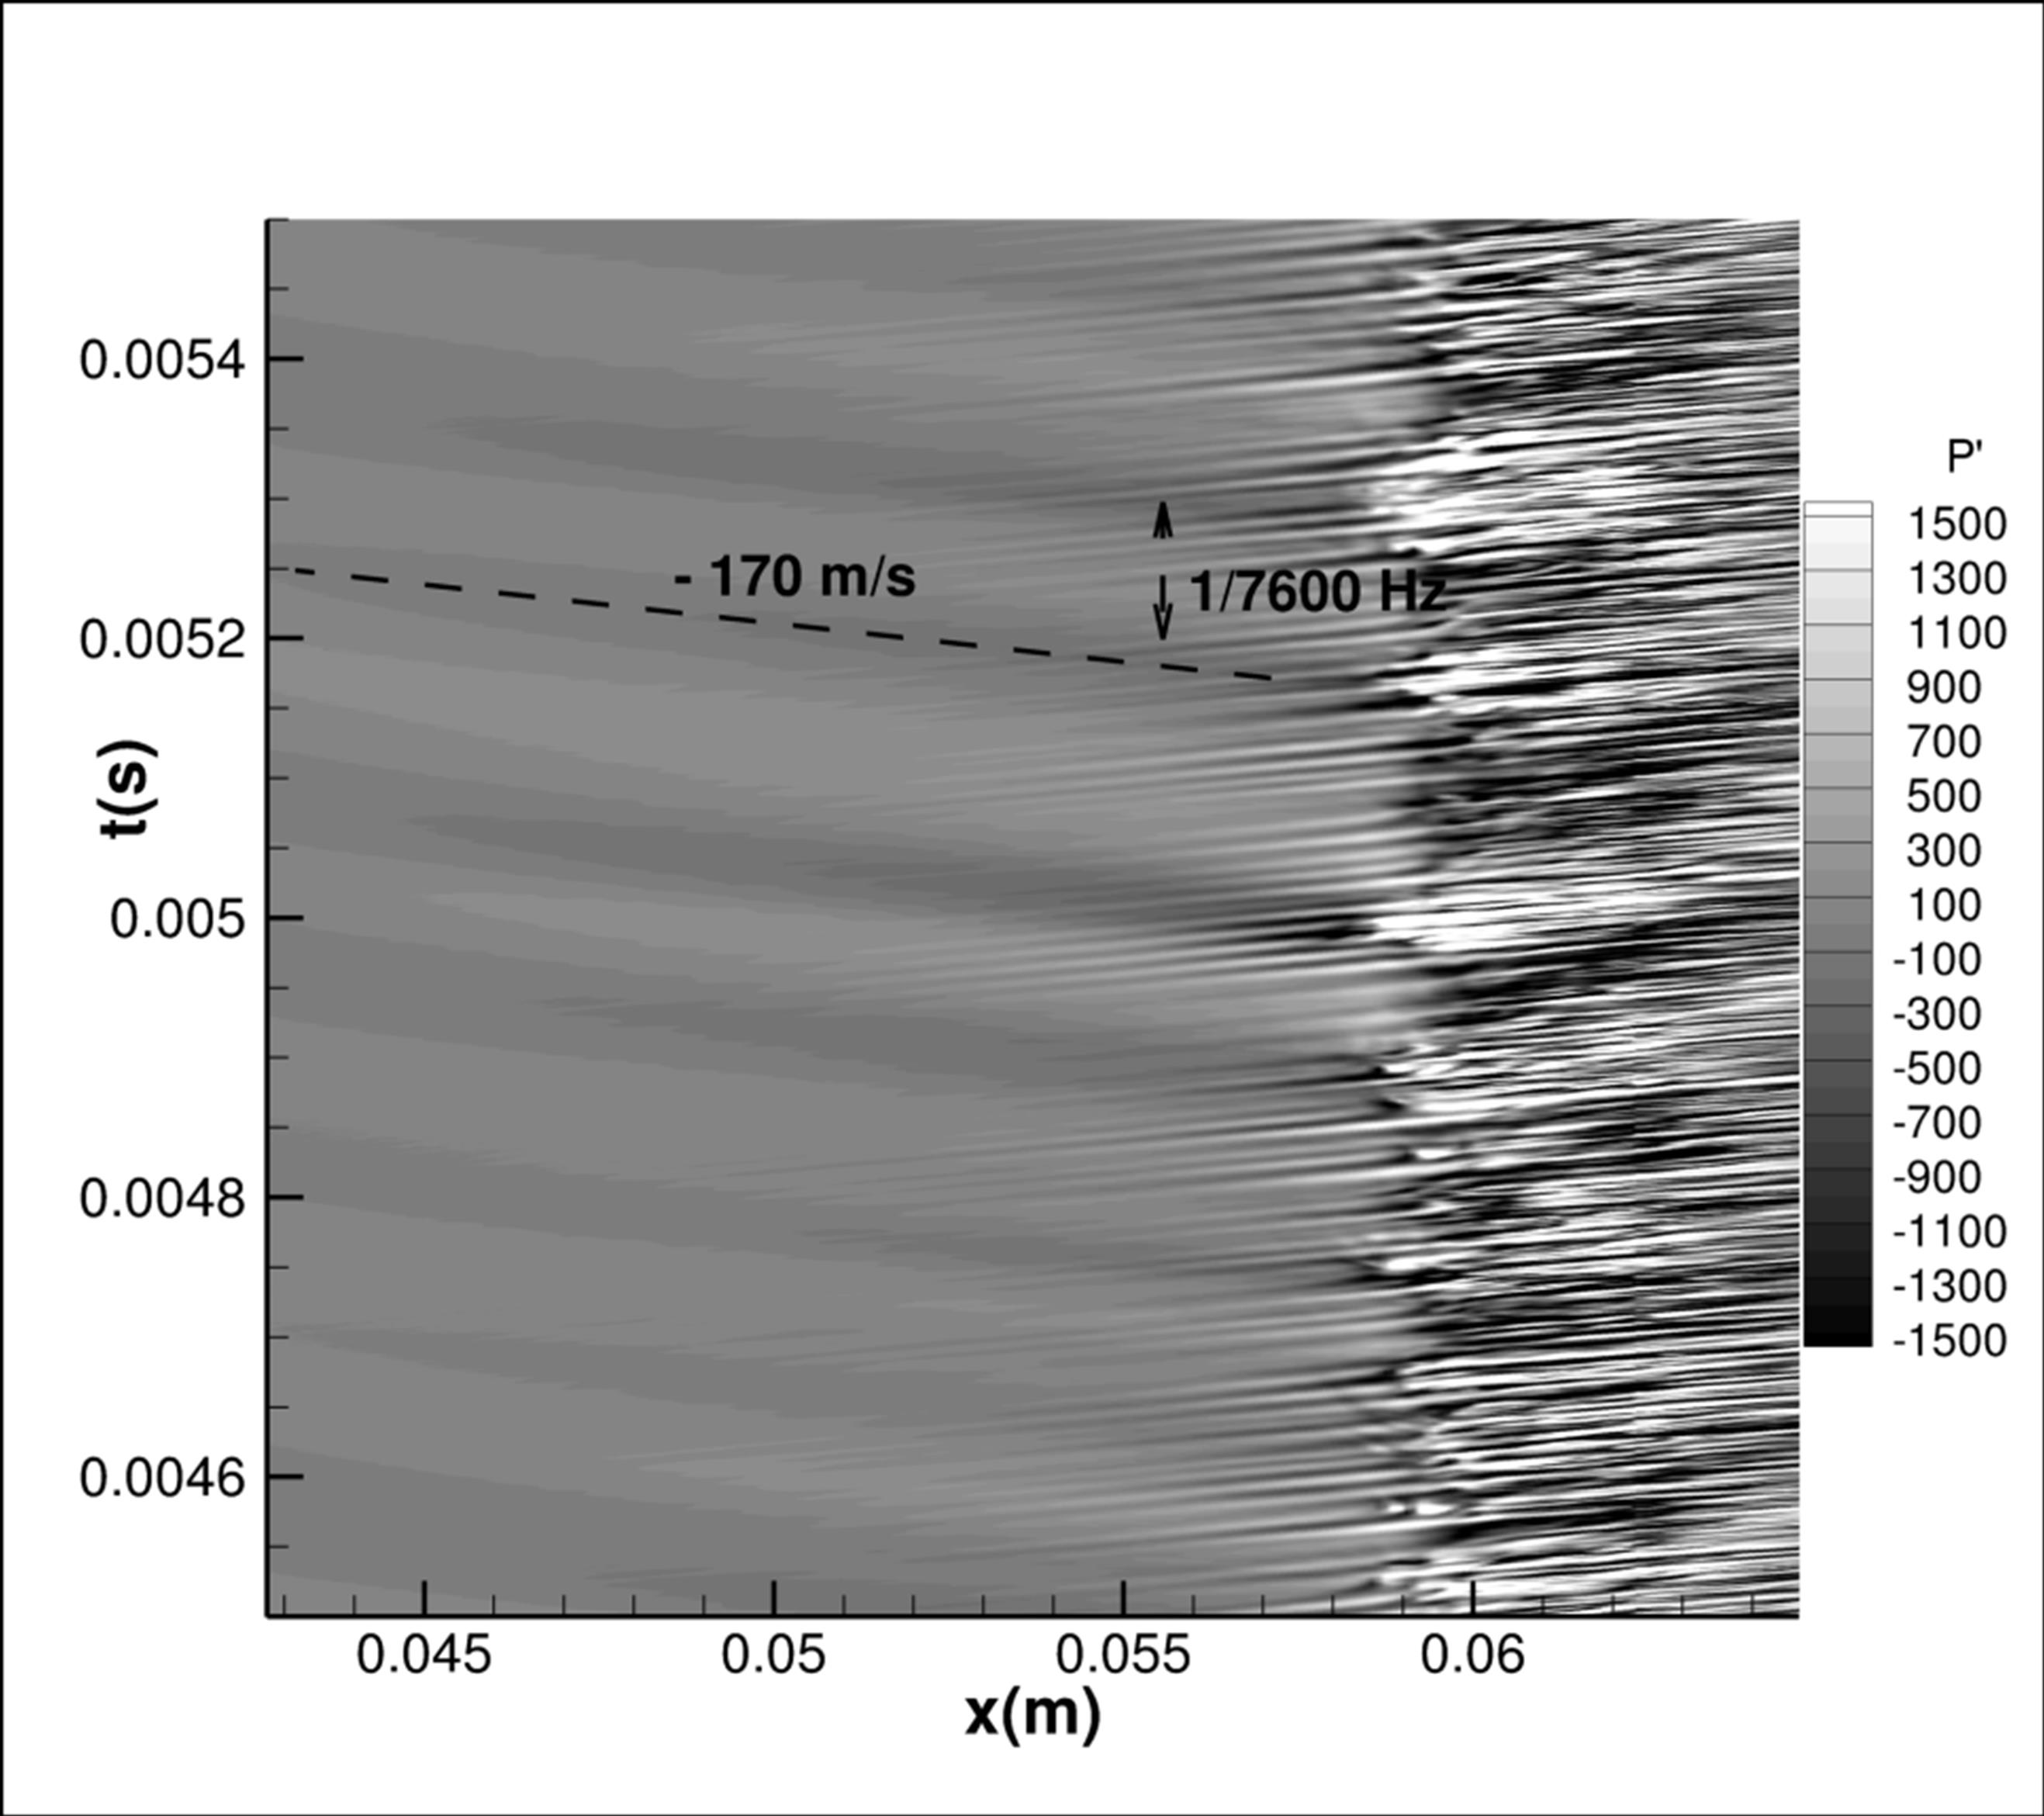
The existence of many pressure "sensors" in the computation makes it possible to compute the temporal evolution of the pressure fluctuations and to present this analysis in Figure 15. The later allows to identify high pressure ridges displacing upstream at a frequency of about 7600 Hz and at a velocity of 170 m/s. Nevertheless, it has not been possible to connect this pressure waves velocity with classical information propagation velocities commonly encountered in compressible flows.